


Welcome to Online Quant Section in letsstudytogether.co. Here we are providing a set of Data Interpretation Quiz for SBI PO mains 2017, Dena Bank, BOB Manipal, NICL AO and NIACL Assisitant Mains exam 2017.

Data Interpretation Quiz
Direction (1-5): In the following multiple graphs production of rice (in quintals) by three countries – India, China and U.S.A has been given. Study the following graphs carefully to answer the questions.
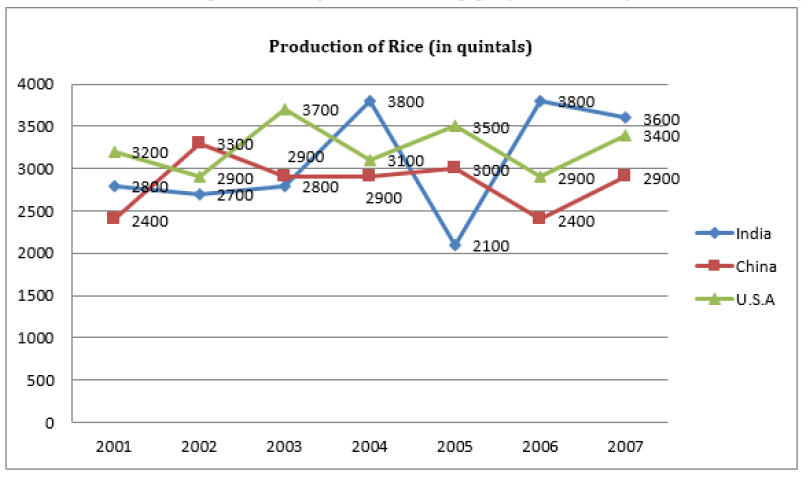
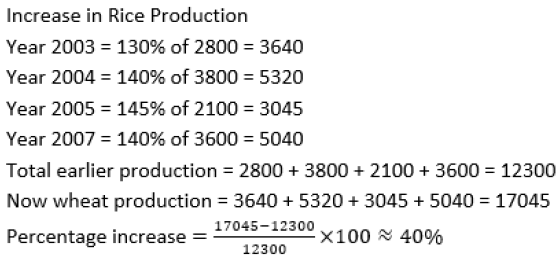
1.If the production of rice by India in the years 2003, 2004, 2005 and 2007 increase by 30%, 40%, 45% and 40% respectively, what will be the overall approximate percentage increase in the production of rice in the state in the given years?
A. 40%
B. 50%
C. 60%
D. 45%
E. 55%
2.What was the average production of rice by all three states in the year 2007? (in quintals)
A. 3400
B. 3300
C. 3200
D. 3100
E. None of these
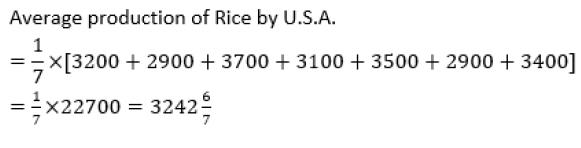
3. In the given years, what is the average production of rice in U.S.A? (in quintals)

4.If the productions of rice in U.S.A in the years 2001, 2002, 2003 and 2004 increase by 20%, 25%, 28% and 35% respectively; what will be the approximate percentage increase in the average production of the countries for the given years?
A. 22%
B. 25%
C. 27%
D. 28%
E. 30%
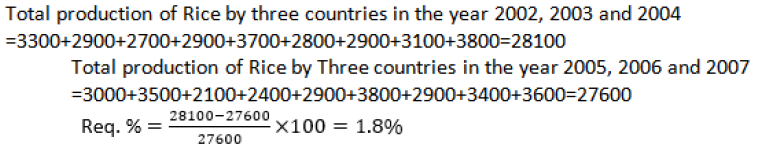
5. By what per cent is the total production of rice by three countries in the years 2002,2003, and 2004 more or less than that in the years 2005, 2006 and 2007?
A. 2.5%
B. 2.6%
C. 2.9%
D. 1.8%
E. None of these
[maxbutton id=”16″ ]
[maxbutton id=”10″ ]
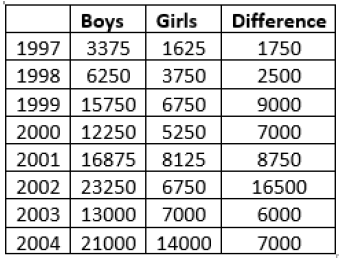
Direction (6-10): Study the following graphs carefully and answer the questions given below. Number of students who appeared (In thousands) and Percentage of girls appeared in an examination over the years.

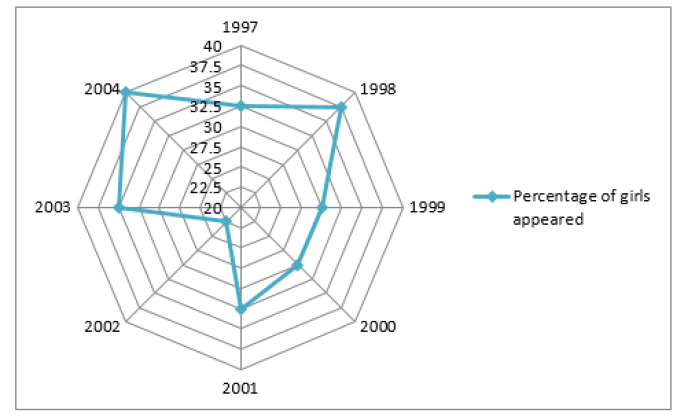
6.In which year the difference between boys appeared to girls appeared in the exam is 2nd maximum ?
A. 2002
B. 2000
C. 2001
D. 1999
E. None of these
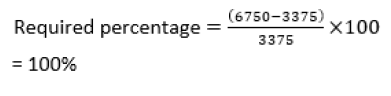
7. Girls appeared in 2002 is what percent more than the boys appeared in 1997 ?
A. 50%
B. 100%
C. 200%
D. 150%
E. None of these
8. If 34% of the girls appeared in 1999 are from Bihar. 1/3 rd of the remaining are from UP, and half of the remaining are from Punjab, then the number of girls appeared from other than the 3 given states is what % of the total number of boys appeared in the same year ?
A. 8.4%
B.10.4%
C. 9.4%
D. 11.4%
E. 5.4%
9.Find the average number of girls appeared per year for the given years ? (Rounded off to nearby integer)
A. 8716
B. 6856
C. 6756
D. 6656
E. 6716
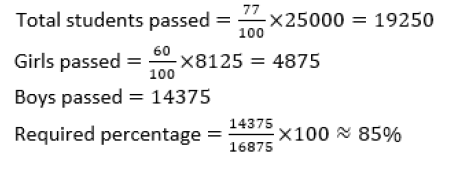
10. If 77% of the students appeared in 2001 passed the exam, while 40% of the girls appeared in the exam failed in this year, then what percent of the boys in this year passed the exam ?
A. 89%
B. 85%
C. 90%
D. 79%
E. 87%
[maxbutton id=”2″ ]
Data Interpretation Quiz
*Detailed Solutions*
[maxbutton id=”8″ ]
1.
2.

3.
4.

5.
[maxbutton id=”1″ ]
6.
7.
8.

9.
![]()
10.
You may also download free Pdf’s and Books : Click here


For more details click here
Thank you, all the best. and lets study together.
Learn Better Do better Be better
Attempt Free Mock Tests & Get Free eBooks


