


Q. (1-5)Study the following information and answer the questions given below.
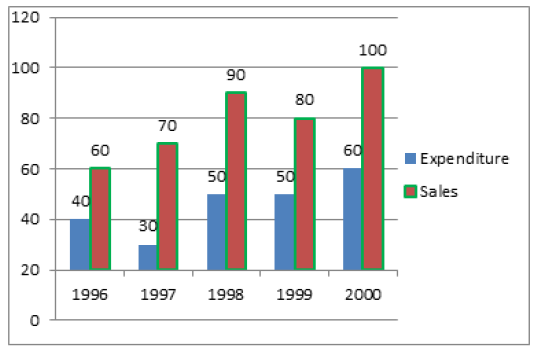
The following Line graph gives information about the expenditure and sales (in lakhs) of company A from 1996 to 2000.

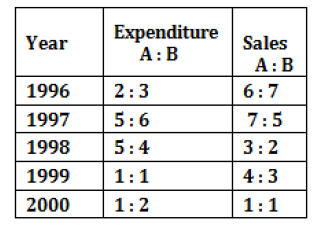
The following table gives the ratio of expenditures and sales of company A and B from 1996 to 2000.
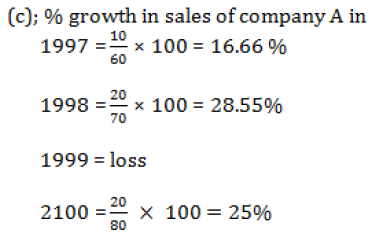
1.In which year the percentage growth in sales of company A was the highest over the previous year?
A. 1996
B. 1997
C. 1998
D. 1999
E. 2000
2.What was the percentage profit of company B in 1999?
A. 25%
B. 50%
C. 66.66%
D. 33.33%
E. None of these
3.What was the total expenditure (in lakhs) of company B from 1996 to 2000?
A. 306
B. 320
C. 334
D. 230
E. None of these
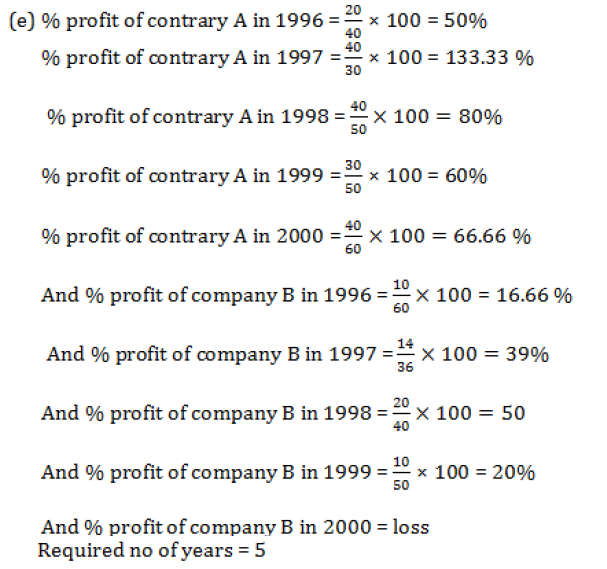
4.For how many years, the percentage proᶬt of company A was more than that of company B?
A. 1
B. 2
C. 3
D. 4
E. 5
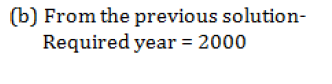
5.In which year, company B has a loss?
A. 1996
B. 2000
C. 1998
D. 1999
E. 1997
Directions (6-10): Study the following chart to answer the questions given below.

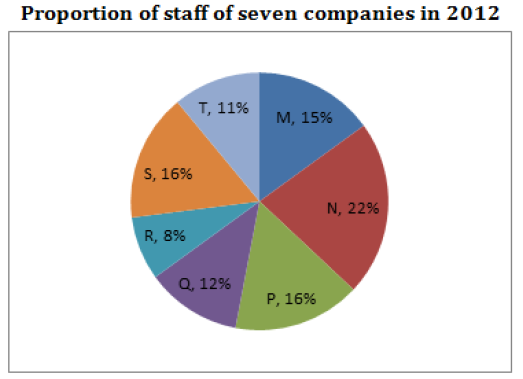
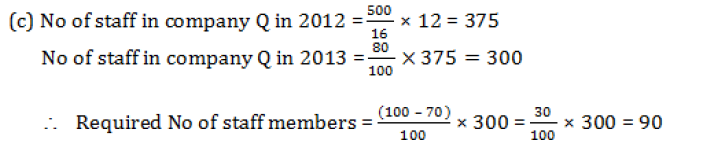
6.In 2013 the number of staff decreased by 20% in company P as well as in company Q. If the number of staff in company P in 2012 was 500 and the percentage of staff members who were at least graduate were 80 and 70 per cent in companies P and Q respectively in 2013, find the number of staff members in company Q who were not graduate for year 2013.
A. 210
B. 60
C. 90
D. 150
E. None of these
7.If the number of staff in company R in year 2012 who were not graduate was 144, what was the number of staff in company S in 2012?
A. 300
B. 600
C. 450
D. 900
E. None of these
8.Which company had maximum number of non-graduates in year 2012?
A. S
B. M
C. N
D. Data inadequate
E. None of these
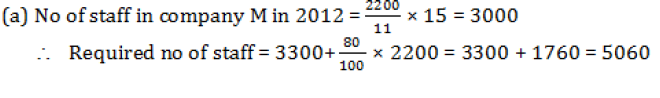
9.In 2014, number of staff in company M increased by 10% and that in company T reduced by 20% from 2012. The number of staff in company T in 2012 was 2200. What is the total number of staff in companies M and T together in 2014?
A. 5060
B. 4760
C. 5500
D. 5200
E. None of these
10.The number of staff in company N in 2013 was 3300. What will be the ratio of the number of graduate staff of company S to R in 2012?
A. 22 : 9
B. 23 : 11
C. 23 : 12
D. Data inadequate
E. None of these
Solution
1.
2.

3.
4.
5.
6.
7.
![]()
8.
![]()
9.
10.
![]()
All the best for your exams..!!!
Learn Better, Do better, Be better.
Attempt Free Mock Tests & Get Free eBooks


