


Welcome to Online Quant Section in letsstudytogether.co. Here we are providing a set of Data Interpretation Quiz for SBI PO mains 2017, Dena Bank, BOB Manipal, NICL AO and NIACL Assisitant Mains exam 2017.

Data Interpretation Quiz
Direction (1-5): The break-up of the volume share of different cars sold by Maruti Car Company in Delhi for year 2002 is shown in figure I. The break up for the year 2003 for maruti car company in delhi was same as that for the year 2002. The breakup of the car market according to market share by volume possessed by different car manufacturing in Delhi for 2002 is shown in figure II.
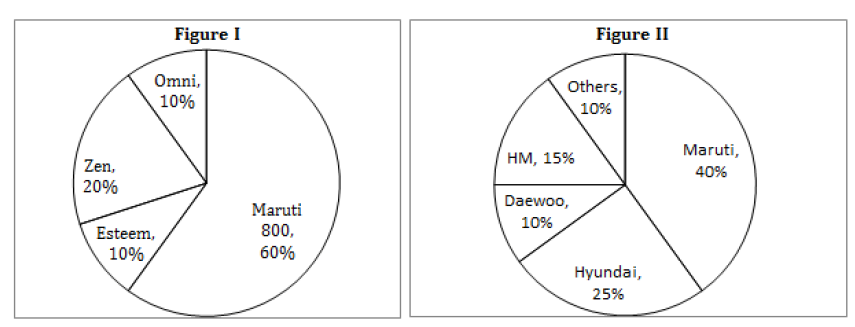
1. If in 2002, the total no. of cars sold in Delhi was 2.5 lakh, then what is the ratio of no. of cars sold by company HM in 2002 to the no. of cars sold by Maruti of models Omini, Zen and Esteem together in the same year?
A. 15 : 16
B. 12 : 13
C. 17 : 15
D. 16 : 15
E. None of these
2. If total no. of cars sold in Delhi in 2002 is 4 lakhs, then how many of the cars manufactured by Maruti remained unsold? Given no. of cars sold by Maruti in 2002 is ![]() of the no. of cars manufactured by it.
of the no. of cars manufactured by it.
A. 0.6 lakh
B. 0.2 lakh
C. 0.4 lakh
D. 0.25 lakh
E. None of these
3. What is the no. of Santro sold in Delhi if Santro accounts for 75% of the Hyundai sales in 2002? The no. of Zen sold in 2002 is equal to 3.0 lakh.
A. 232489
B. 730125
C. 703125
D. 264489
E. None of these
4. If the total sales of cars in 2002 in India was 24 lakh and Delhi constituted 5% of India’s total car sales then what was the sales of Maruti 800 in Delhi?
A. 26400
B. 24200
C. 27000
D. 28800
E. None of these
5. If total sales of cars in Delhi in 2002 was 3 lakh and it increased by 20% in 2003, then find percentage increase in the sales of Omni in 2003?
A. Can’t be determined
B. 25%
C. 20%
D. 22%
E. 14.25%
You may also like Data Interpretation Quiz set 1 – 10.
Direction (6-10):

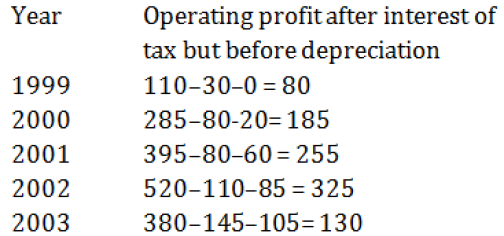
6. For which year is the operating profit after interest and tax but before depreciation the highest?
A. 2002
B. 2003
C. 2001
D. 2000
E. None of these
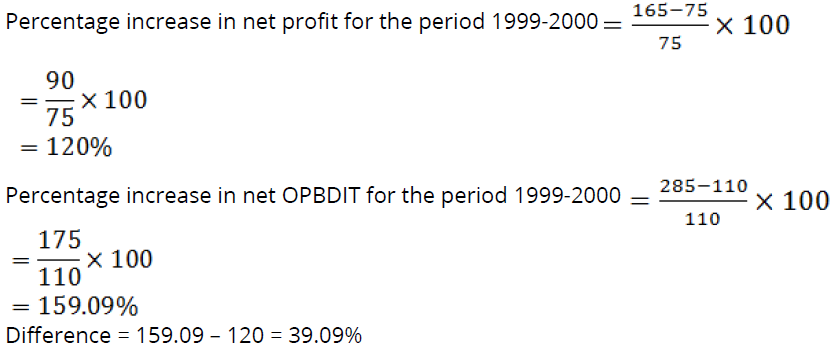
7. What is the approximate difference between the percentage increase in net profit for the period 1999-2000 and the OPBDIT for the period 1999-2000?
A. 30%
B. 39%
C. 23%
D. 27%
E. 49%
8. Which of the following has witnessed a growth across all the years?
A. Depreciation & OPBDIT
B. Depreciation & net profit
C. Tax and Depreciation
D. Net profit & other income
E. Tax and net-profit
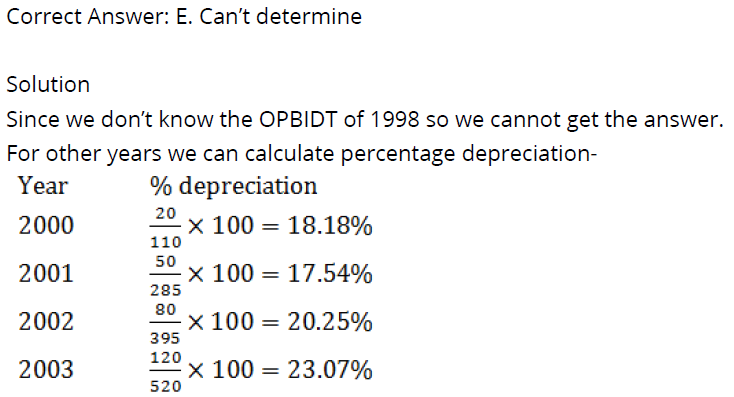
9. Assuming that the amount depreciated in any year is a percentage of the OPBDIT acquired by the company in the previous year, in which year did the company see the maximum percentage of depreciation?
A. 2003
B. 2001
C. 2002
D. 2000
E. Can’t determine
10. The average net profit for the period 1999-2003 is what % of the average interest for the same period? (Calculate up to two decimal points)
A. 147.28%
B. 140.35%
C. 126.46%
D. 157.30%
E. None of these
*Detailed Solutions*
1.

2.

3.

4.
![]()
5. Since market share for the year 2003 is not given, the answer can’t be determined.
6.
7.
8. Correct Answer: C. Tax and Depreciation
It can be clearly observed form the table.
9.
10.

You may also download free Pdf’s and Books : Click here


For more details click here
Thank you, all the best. and lets study together.
Learn Better Do better Be better
Attempt Free Mock Tests & Get Free eBooks


